Indiana University and Santa Barbara City College help students succeed with course-level dashboards
Data transparency accelerates decision making
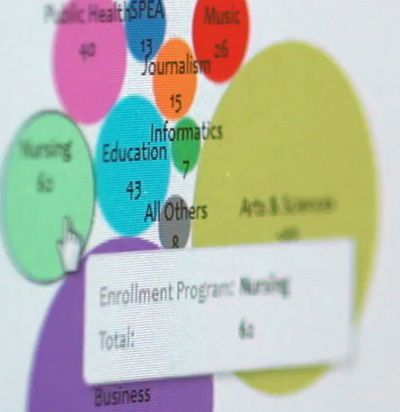
Uncover registration trends for 100,000 students in seconds
Increased ability to support student success
Indiana University (IU), a leading research university and Santa Barbara Community College (SBCC), a beachside community college are radically strengthening their educational programs and student resources with data. With Tableau, university staff can drill down into data sets to understand the factors that impact student success—including enrollment, course offerings, and classroom sizes. Today with Tableau, both universities can now take corrective action quickly, opening up new courses or intervening when a student is struggling.
The biggest surprise was how easy it was to use. We can uncover trends easily. Things that used to take us hours now take us mere seconds.
Indiana University: Empowering 100,000+ students to achieve their goals
Indiana University (IU) enrolls more than 100,000 students, operating two core campuses, several satellite campuses and online programs, and offering more than 500 academic programs. The student body is highly diverse, coming from different parts of the world, at different times in their life, with different academic and professional goals.
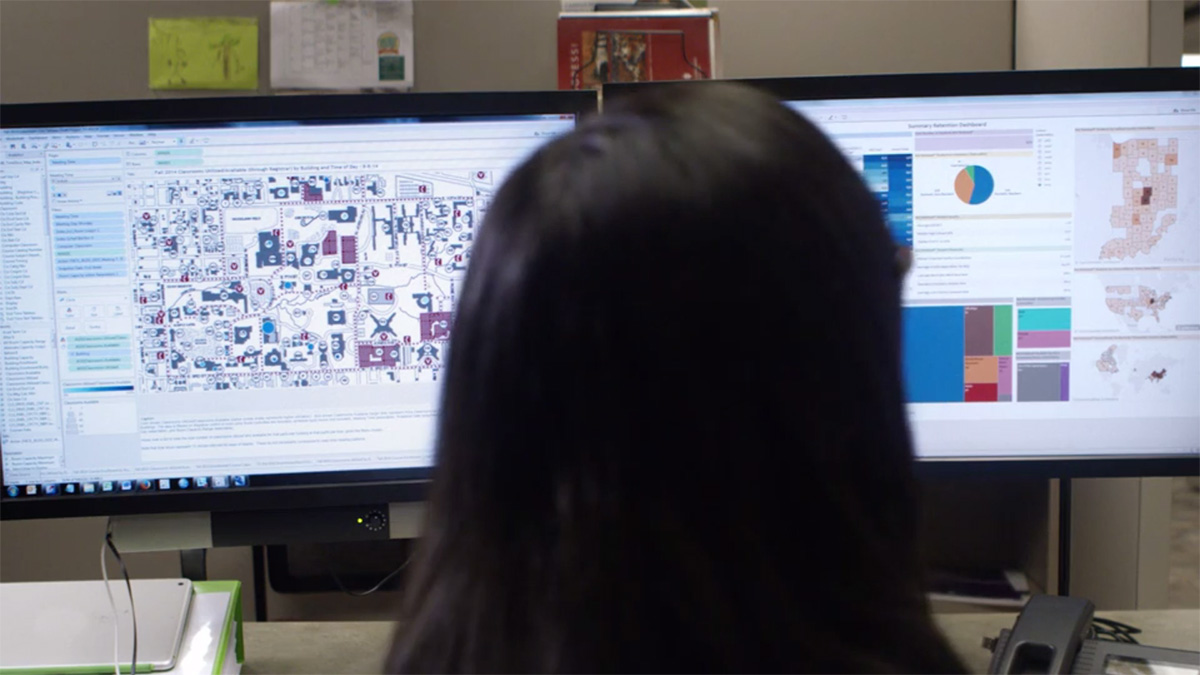
Bridgett Milner, Senior Associate Director of Strategic Planning and Research in the Office of Enrollment Management researches undergraduate student recruitment, enrollment, and retention to drive projects related to student achievement. Among all of their responsibilities, the office uses Tableau to identify trends and gaps within course offerings that could potentially impact student success.
“My job is monitoring and ultimately proposing courses of action to help IU become an even more amazing place,” shares Bridgett.
When the team adopted Tableau, they were surprised by how quickly they could start analyzing data. “[What’s impactful is] getting that data in Tableau and uncovering trends easily. Things that often took us hours now take us mere seconds.”
Bridgett’s role requires creating reports and building predictive models, regularly sharing her findings with senior leadership and policy makers to drive strategy around admission and scholarship offerings. “Having a tool where we can easily break things apart when we're making decisions is powerful,” says Bridgett.
“College is this great place,” says Bridgett. “My job is ultimately proposing courses of action to help become a more amazing place. Ideally, we're recruiting and enrolling a great class that then graduates.”

Right away, we built things that were useful and revealing. And for a small department like ours, that's huge.

Santa Barbara City College: Making smarter enrollment and counseling decisions with a small team
Santa Barbara City College (SBCC) is one of the oldest colleges in California, enrolling between 17,000 to 20,000 students annually. Some attend school full-time during the day, while others attend school part-time at night. Despite the fact that each of these students are unique, all of them need to enroll in the right course at the right time to achieve their academic goals.
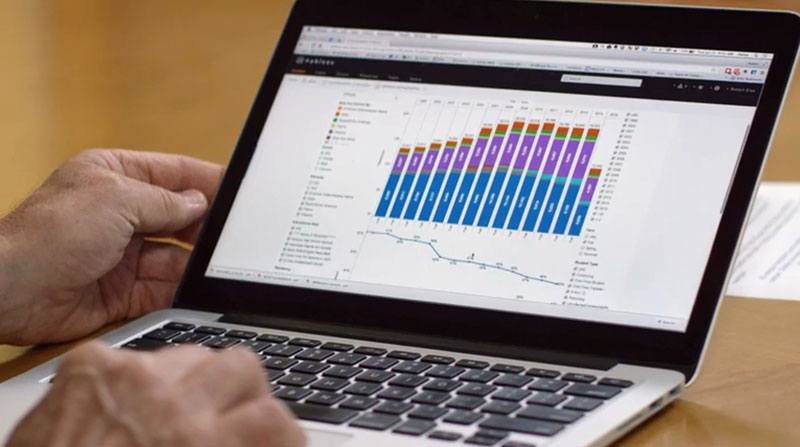
SBCC’s Institutional Research and Planning department is a small team responsible for understanding the scope of classes the student body needs to be successful. The team relies on data to make critical decisions about course offerings, classroom sizes, facility needs, and more. SBCC also uses Tableau dashboards to evaluate overall academic performance against peer institutions in California and nationwide.
For example, SBCC staff use data to understand how students’ course schedules impact grades and ultimately, graduation rates.
“Right away, we built things that were useful and revealing. And for a small department like ours, that's huge,” said Robert Else, Senior Director of Institutional Research and Planning, Santa Barbara City College when asked about Tableau.
“I’m convinced that having Tableau contributes to the success across campus,” says Robert.
You break down silos and you're seeing the college as a whole. Tableau has helped the school to make better decisions that affect student success.
In addition to understanding granular data, the team also uses Tableau to gain a 360-view of college operations, “You break down silos, and you're seeing the college as a whole, which any organization really ought to be doing. Tableau has helped the school to make better decisions that affect student success.”
For instance, Deans can now manage course enrollment at the department level with Tableau dashboards. They rely on data to determine when to open additional courses, update course descriptions, or cancel classes altogether to reallocate resources. That means, SBCC students, regardless if they attend school full-time or part-time, can trust the courses they need will be available to them.
SBCC counselors also use Tableau to quickly identify the students that may need additional assistance outside of the classroom—allowing them to actively reach out to students before they lag behind.