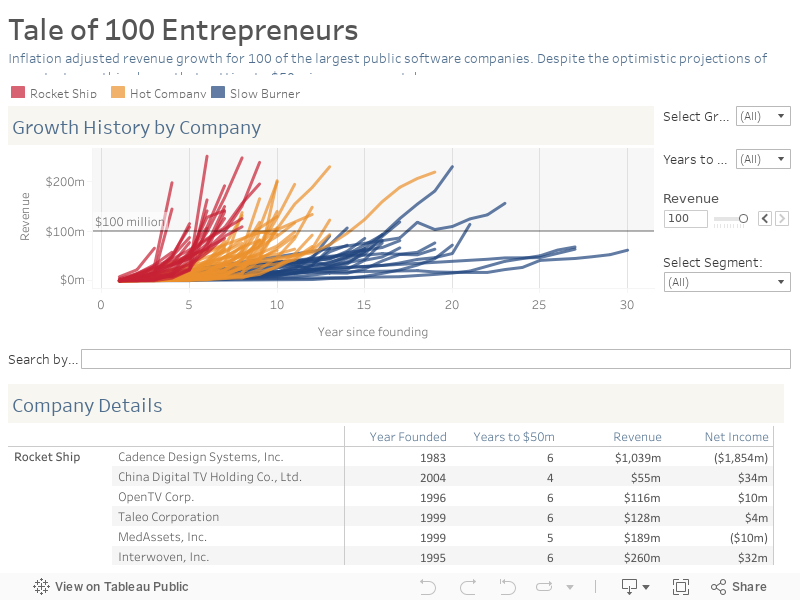
Tale of 100 Entrepreneurs
The visualization is filled with investment stories and insights. For instance, most successful technology companies aren’t rocket ships. Only 28% of the nation’s most successful public software empires were rocket ships. (A rocket ship is defined as a company that reached $50 million in annual sales in 6 years or less.)
Create and share on Tableau Public
Join the newsletter and find daily inspiration with the Viz of the Day. Yours could be featured next!
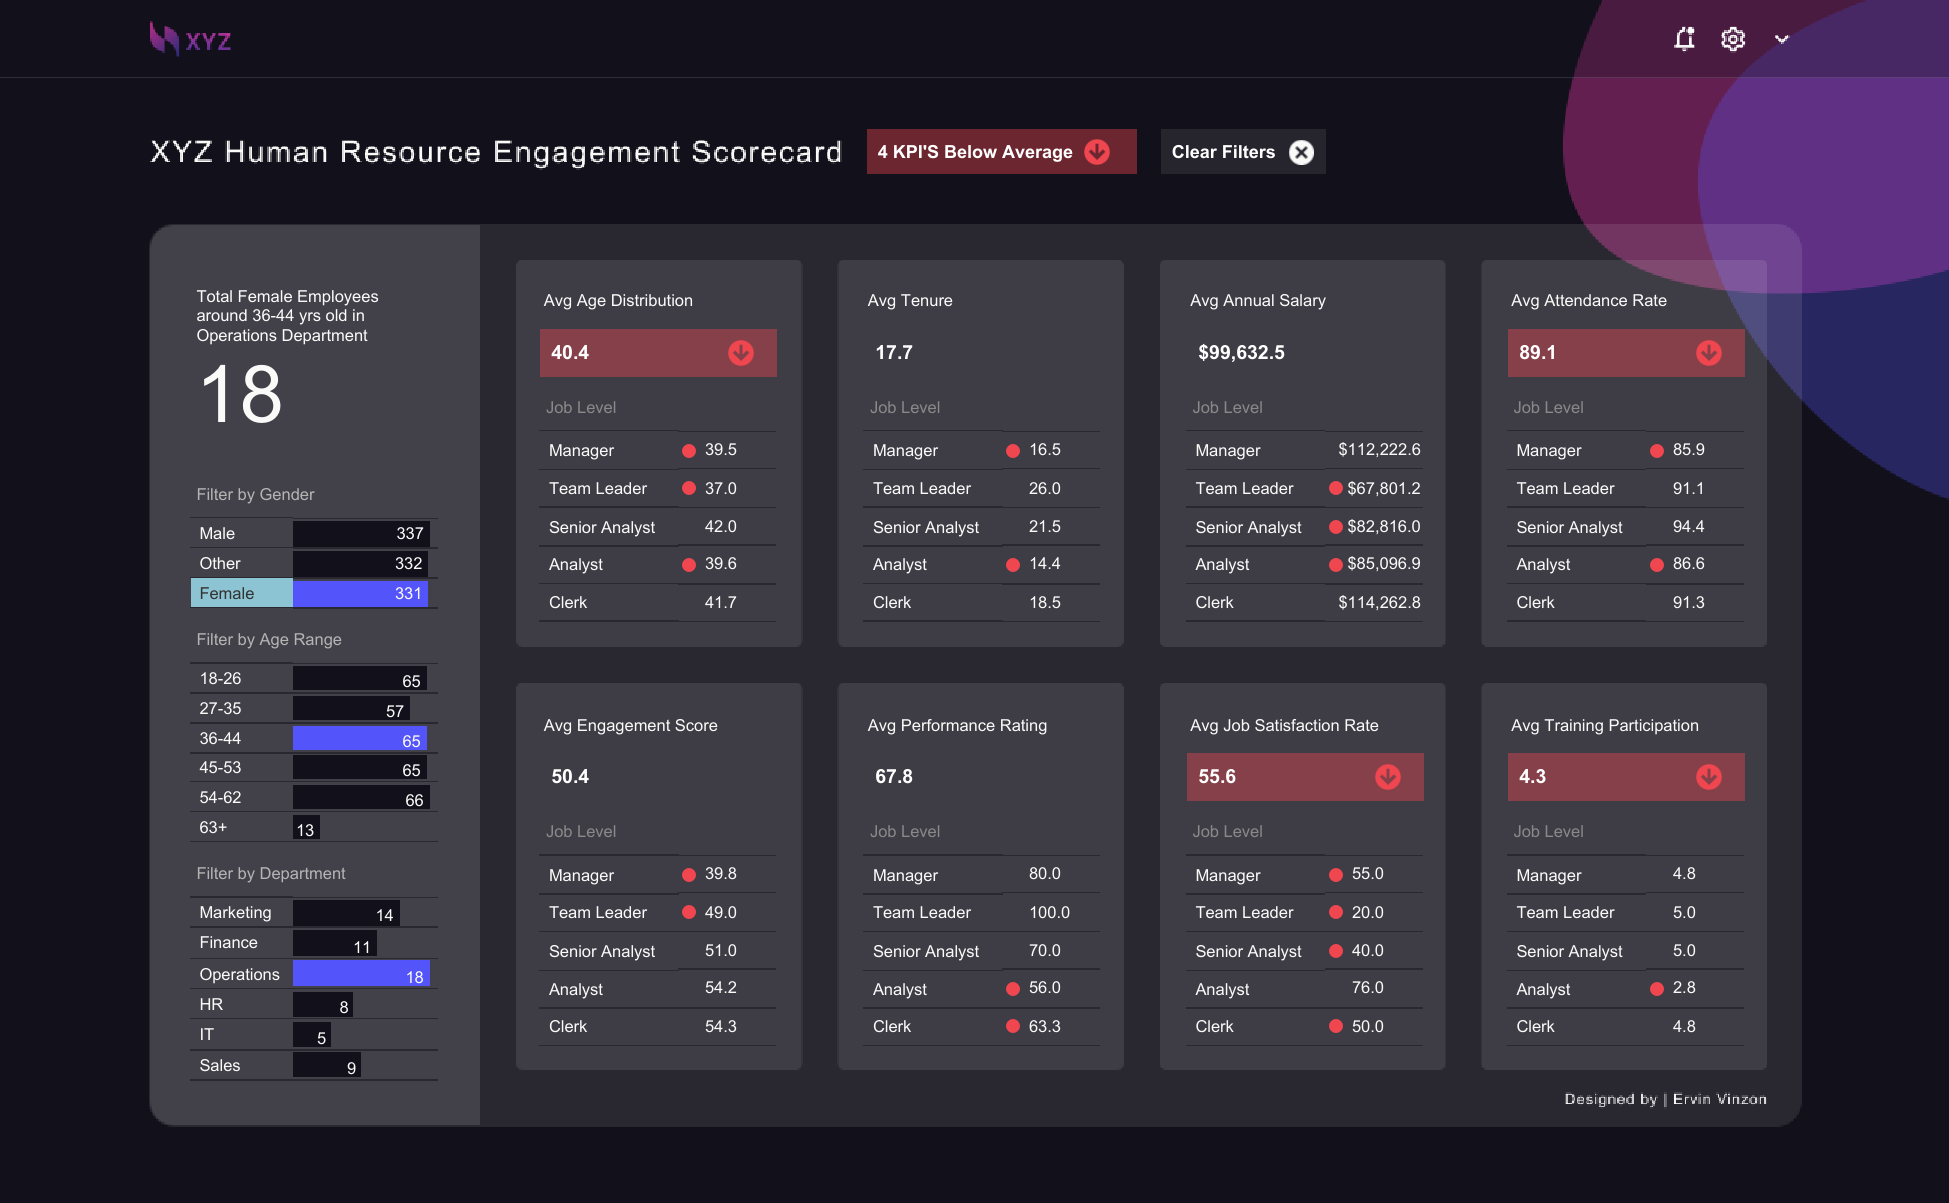
XYZ HR Engagement Scorecard
Learn how BANs can help you clearly display key metrics with this #VizOfTheDay by Ervin Vinzon. This Back 2 Viz Basics (#B2VB) entry visualizes employee engagement metrics using mock data by Adam Mico's GPT, Data Mockstar.
Interact with the viz