Make sense of millions of rows of stock data
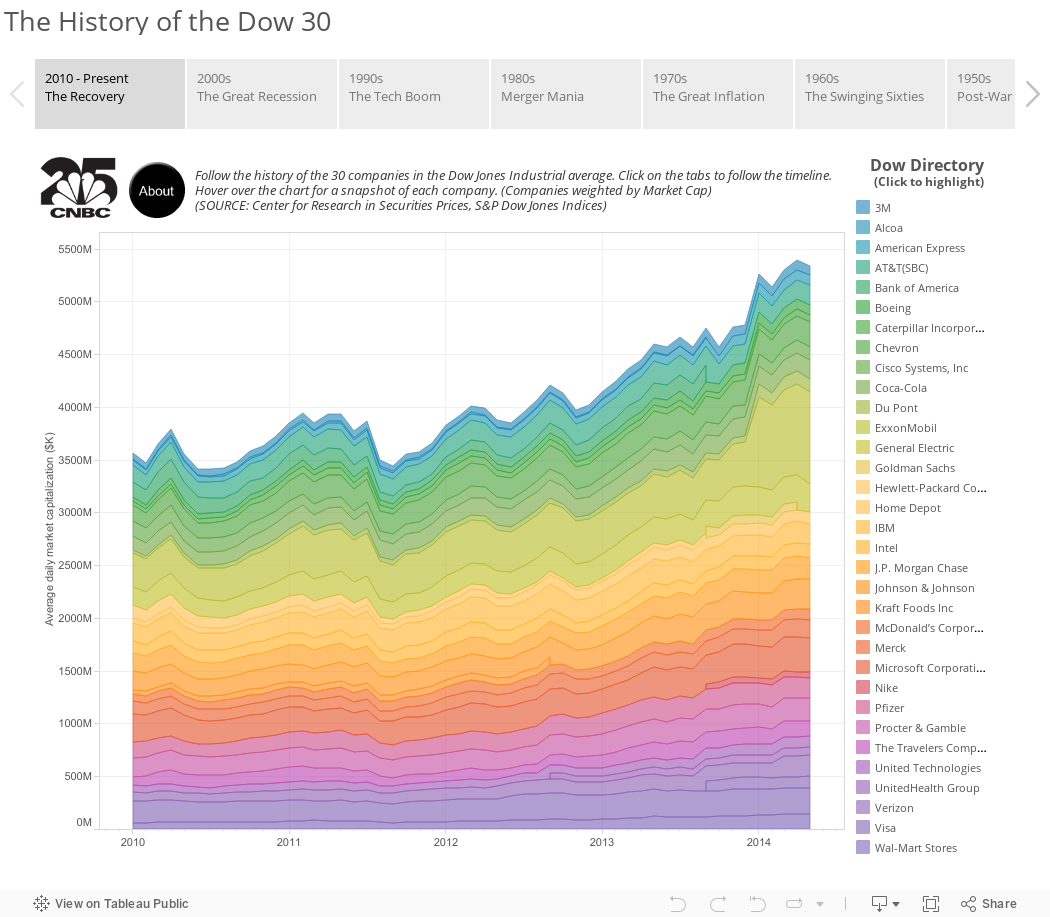
This dashboard uses millions of rows of stock data to show trends in key securities. It was built without any programming by a regular business user. Tableau empowers people to ask and answer their own questions of the data at the speed of thought. Digging deeper into the data is as easy as dragging and dropping, pointing and clicking.
Learn more about how Tableau can help you explore Big Data.