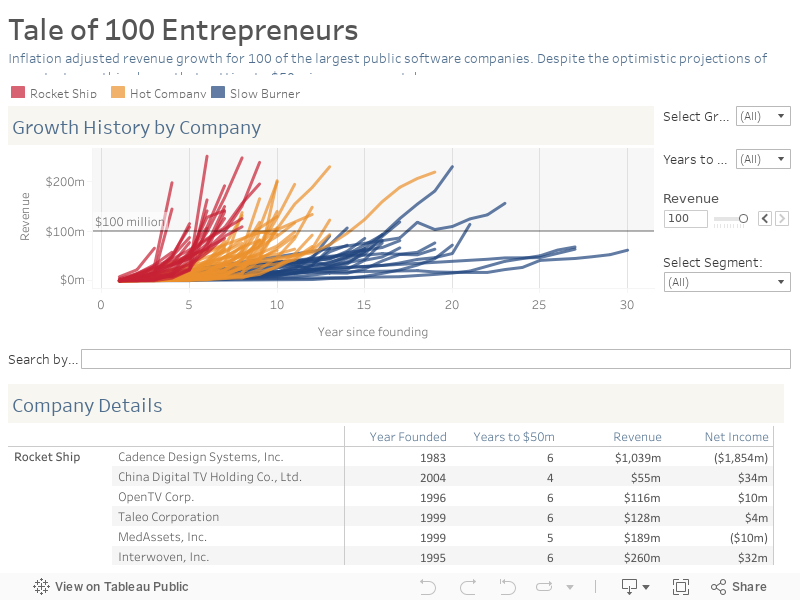
Tale of 100 Entrepreneurs
The visualization is filled with investment stories and insights. For instance, most successful technology companies aren’t rocket ships. Only 28% of the nation’s most successful public software empires were rocket ships. (A rocket ship is defined as a company that reached $50 million in annual sales in 6 years or less.)
Create and share on Tableau Public
Join the newsletter and find daily inspiration with the Viz of the Day. Yours could be featured next!

The Price of Prosperity
In this #VizOfTheDay, Serena Purslow uses area charts, scatter plots, and maps to explore the relationship between CO2 emissions, GDP growth, and global population trends over time. Highlighting the urgent call for sustainability action.
Interact with the viz